Where to put “content” and where to “demo” functionality!
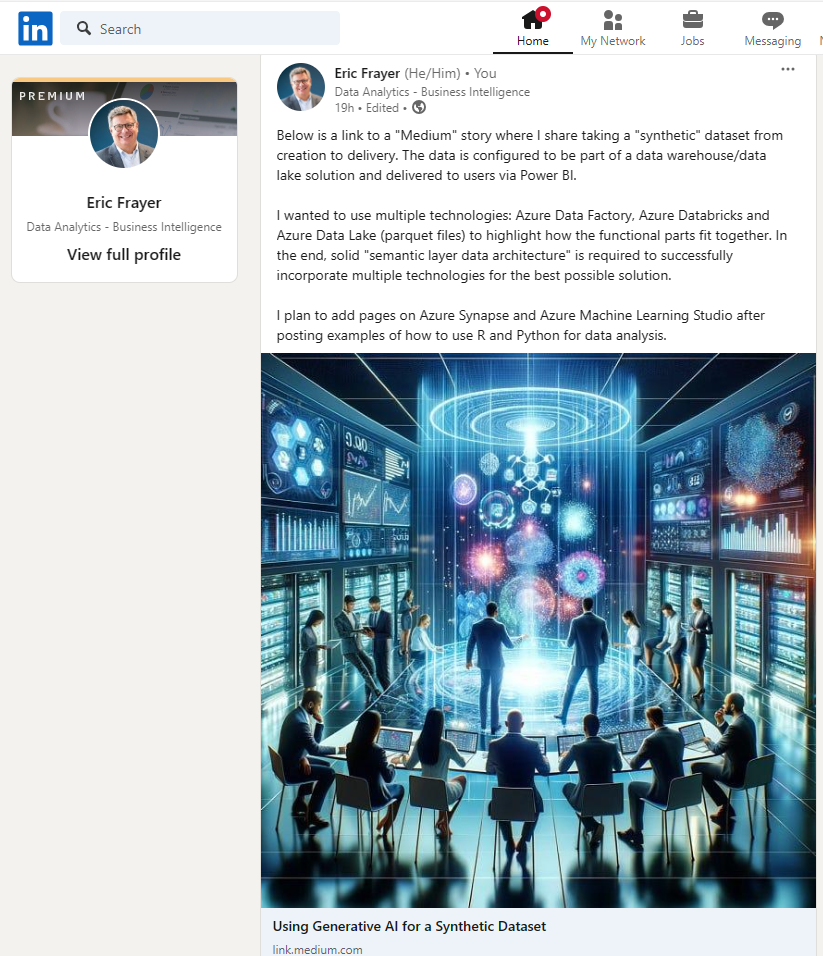
Recently, I’ve been looking more into posting on LinkedIn and Medium. In addition to my personal blog, I wanted a place to highlight my interests and what I’m working on. I’ve used knowledge management and sharing tools like Confluence, SharePoint and OneNote to post my thoughts on work related topics on “intranets” in places where I’ve worked.
Now, I’d like to post more online so I can find information quickly and share with others. As part of this I’m using this blog, my LinkedIn space and Medium as places to post and share.
The idea is to expand on my writing and capture more “online” than in OneNote. I’m also looking at Notion.ai which may be where I end up putting more “content” this year.