Data Architecture is the foundation for effective BI and AI.

Delivering timely and actionable insights demands robust data architecture.

Modern Data Architecture: Acquire, Organize, Analyze and Deliver

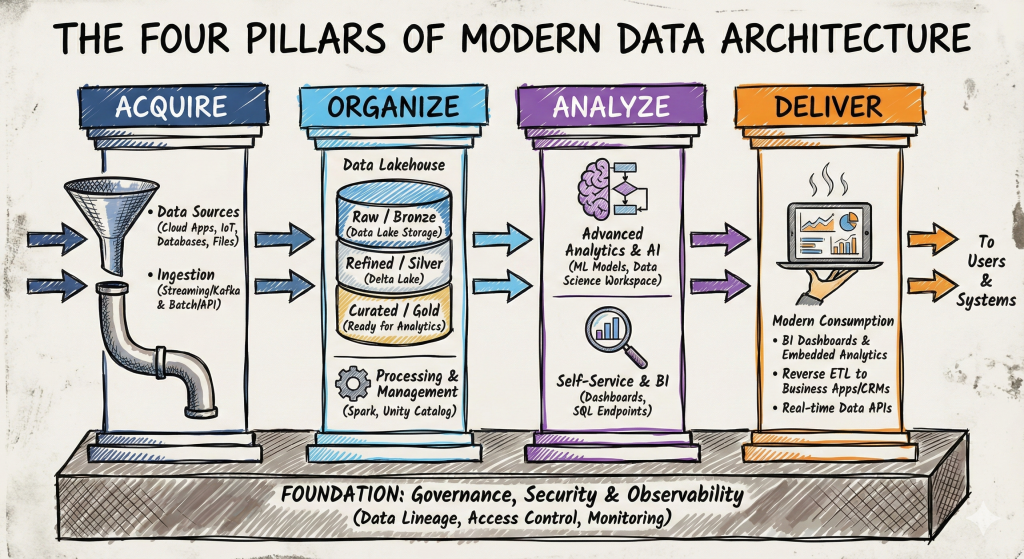
I’ve used a form of this visualization for years to highlight how I approach data and analytics. On the backend, “Acquiring” and “Organizing” data requires accessing data in a variety of ways. Traditional ETL loads and updates incrementally to data warehouses or data lakes. I’ve used multiple ETL/ELT tools to pull data from relational OLTP systems and extracts into a data warehouse/data lake where it can be transformed to support dimensional modeling. “Analyzing” and “Delivering” data involves a Semantic layer (e.g. often a well-formed OLAP cube) to serve as a single source of truth for Business Analysts, BI Developers and Data Scientists.

The compute engine generally uses a proprietary syntax (e.g. DAX in Power BI, Calculation Syntax in Tableau or Set Analysis commands in Qlik) to allow for the efficient slicing and dicing of data. Making sure the transformations and measures are well understood, accurate and consistent is a principal requirement of a professional Data Architect.

To read more, please visit my Medium site.

Coronavirus-19

This is a difficult time for many of us. My thoughts are first with all of the people suffering from the disease and it’s impact. Also with the heroic first responders, the men and women who are risking their own lives to save others.
There are a number of interesting site I’ve been following to get more info. The site below does a great job of explaining the growth of the virus and how to tell if we are flatting the curve.

The original Johns Hopkins site uses a map delivered by ESRI and ArcGIS to track the progression of the virus:
https://gisanddata.maps.arcgis.com/apps/opsdashboard/index.html#/bda7594740fd40299423467b48e9ecf6

Microsoft Analysis Services

In 2012, I picked up a copy of Teo Lachev’s “Applied Analysis Services.” The book featured how Microsoft was pulling together Excel, Power View, Power Pivot, Tabular Modeling and the new DAX Language (Data Analysis eXpressions). The traditional OLAP SSAS MDX cube wasn’t going away but the new hardware options and increased need for self service meant a new technology was required. DAX uses standard Excel formula syntax. This provided business users with a way to extended Excel logic, formulas and calculations. The power of Excel with the promise of self service BI is pretty compelling.

During my time at Qlik (2012-2017), Microsoft continued to build and expand it’s products. With the Tabular model , Microsoft adopted a “columnstore indexing” strategy using Vertipaq. This allowed for much more data to be available on disk and in-memory.

For more info visit: https://docs.microsoft.com/en-us/analysis-services/

Google Analytics

This is just a quick post to share I’m using this site mainly as a “technical sandbox”. Someplace to try out different functionality and post working examples. I’m using Google Analytics in a browser and app on my phone to see if I’m getting any traffic. Most of my “users” are friends, colleagues and potential employers who’ve I’ve given the url.

Anyway here is a page from Google Analytics for my site. I guess it shouldn’t be surprising how much Google provides for developers and internet users.

Learning Online

It’s amazing how many free or low cost learning solutions exist online. Currently, I’m using DataCamp, Udemy, and Code Academy. I’m also following specific experts including Nathan Yau, Hadley Wickham and Graham Williams.